Students's t-Test for x̄ = 11, μ = 15, s = 5.6, n = 28 & α = 50%
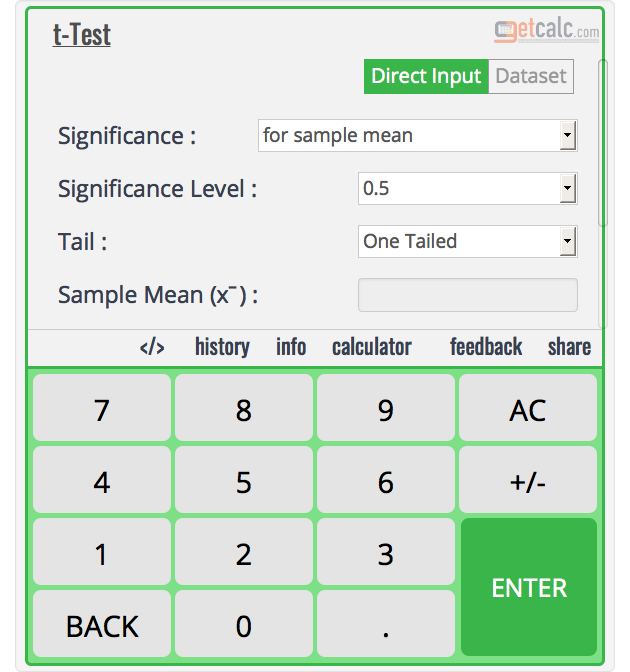
 Student's One Tailed t-test summary & example for test of significance (hypothesis) for mean of small samples from population with unknown variance by using t-statistic (t0) for sample mean x̄ = 11, population mean μ = 15, sample standard deviation s = 5.6 & sample size n = 28 and critical value (te) from t-distribution table at 50% significance level for the degrees of freedom ν = 27.
| Calculation Summary | |
|---|---|
| sample mean (x̄) | 11 |
| mean (μ) | 15 |
| standard deviation (s) | 5.6 |
| sample size (n) | 28 |
| Significance Level (α) | 0.5 |
| t0 | 3.7115 |
| te | 1.18 |
Work with Steps for n = 28, x̄ = 11, s = 5.6, μ = 15 & α = 50%
The below is the example work with steps for test of significance (H0) for mean of small samples from population with unknown variance is generated for x̄ = 11, μ = 15, s = 5.6 & n = 28 may helpful for beginners or grade school students to learn how to solve t-test worksheet or homework problems efficiently by using t-statistic & critical value of t from t-distribution table.
Workout :
step 1 Address the formula input parameters and values
sample mean (x̄) = 11
mean (μ) = 15
standard deviation (s) = 5.6
sample size (n) = 28
Significance level (α) = 0.5
step 2 Substitute sample mean, mean, standard deviation, sample size value in the below formula for test of significance for mean.
=11 - 15(5.6 / √28- 1)
step 3 To find t0, simplify the above expression
=4(5.6 / √28- 1)
=4(5.6 / √27)
=4 x 5.19625.6
=20.78465.6
t0= 3.7115
step 4 Find the expected or critical value (te) from one tailed t-distribution table for degrees of freedom ν = n-1 = 27
The critical value te for d.f 27 at 0.5 significance level is 1.18
t e = 1.18
Inference
t0 > te
The null hypothesis H0 is rejected since t0 = 3.7115 is greater than the critical value for degrees of freedom te(26) = 1.18. Therefore, there is significant difference between the sample & population means.
