Student's t-Test (t0, te & H0) Calculator
Student's t-test calculator for test of significance (hypothesis) for single mean, difference between two means & two equal sample sizes (paired t-test) by using t-statistic (t0) & critical value of t (te) for small samples of population in statistical surveys & experiments. This calculator is featured to generate the complete work for test of significance for small samples using one or two tailed t-test may helpful for grade school students to solve t-test worksheet or homework problems.
t-Test & it's Applications
Statistics & probability functions are used in almost every fields such as math, science, engineering, finance, health, digital networks, data processing, social concerns, etc to research & analyze the data distributions to draw conclusions to improve the quality of process or services. Regardless of any fields, user can analyze, model, design & test any statistical surveys or experiments by using these below calculators to get the summary of data.
Student's t-Test Formulas
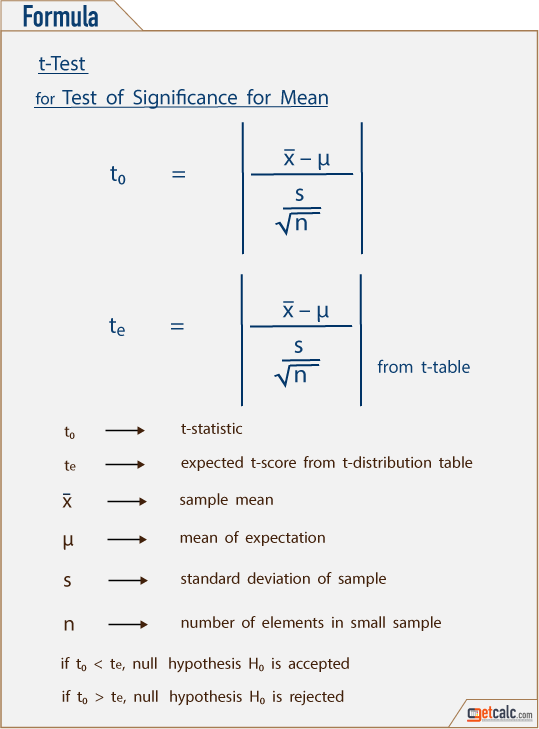
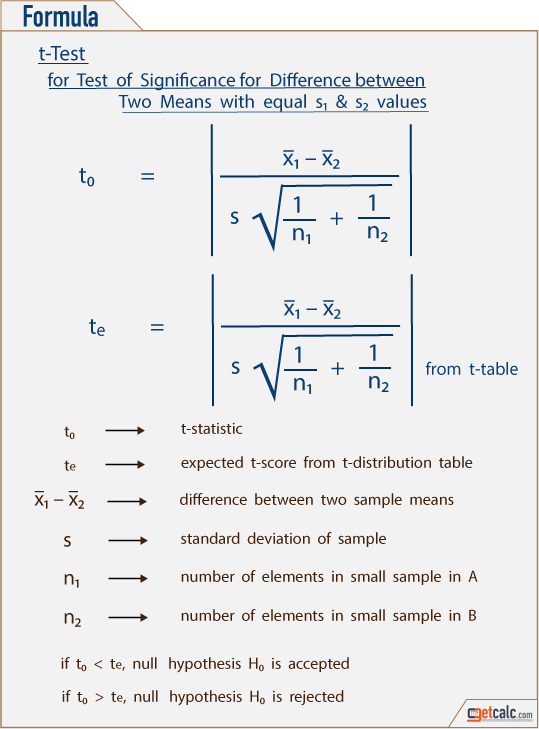
In the theory of statistics & probability, the below formulas are the mathematical representation to estimate the t-statistic for the test of significance for sample mean with unknown population variance, difference between two sample means with equal but unknown population variance & related samples with unknown population variance. Users may refer these below formulas to know what are all the parameters are being used in the test of hypothesis for small samples. Users may use this one or two tailed t-test calculator to verify the estimation along with the complete work for test of significance using t-distribution table.


Critical Value (Rejected Region) from T-Distribution Table
Test of Significance using t-Test
The difference between the sample mean or means is not significant, if the calculated or t-statistic t0 value is lesser than the rejection region value (t-critical) from the t-table. Therefore, the null hypothesis H0 is accepted. The difference between the sample mean or means is significant, if the calculated or t-statistic t0 value is greater than the rejection region (t-critical) value from the t-table. Therefore, the null hypothesis H0 is rejected.
Solved Example Calculations
The below are the solved examples with step by step estimation for the test of significance for sample mean with unknown variance, test of significance for difference between two sample means with equal but unknown population variance & test of significance for relative samples (paired t-test) with unknown population variance using t-test. In addition to the below examples, users can generate complete work for one or two tailed t-test for any corresponding input values.

