Tables to Find Critical Values of Z, t, F & χ² Distribution
Statistic tables to find table or critical values of Gaussian's normal distribution, Student's t-distribution, Fishers's F-distribution & chi-square distribution to check if the test of hypothesis (H0) is accepted or rejected at a stated significance level in Z-test, t-test, F-test & chi-squared test accordingly. In the hypothesis test, the estimated or calculated Z-statistic, t-statistic, F-statistic & χ2-statistic is compared to the critical or rejection region values (p-value) of single or two tailed Z-distribution, t-distribution, F-distribution & χ2 obtained from each respective table to test the hypothesis. All the tables are available in html & PDF download format.
Normal Distribution Table for Z-Test
Normal-distribution table & how to use instructions to quickly find the critical (rejection region) value of Z at a stated level of significance (α = 0.01, 0.05, 0.1 etc or α = 0.1%, 5%, 10% etc) for the test of hypothesis (H0) in z-test conducted for normally distributed large sample sets in the statistics & probability surveys or experiments.

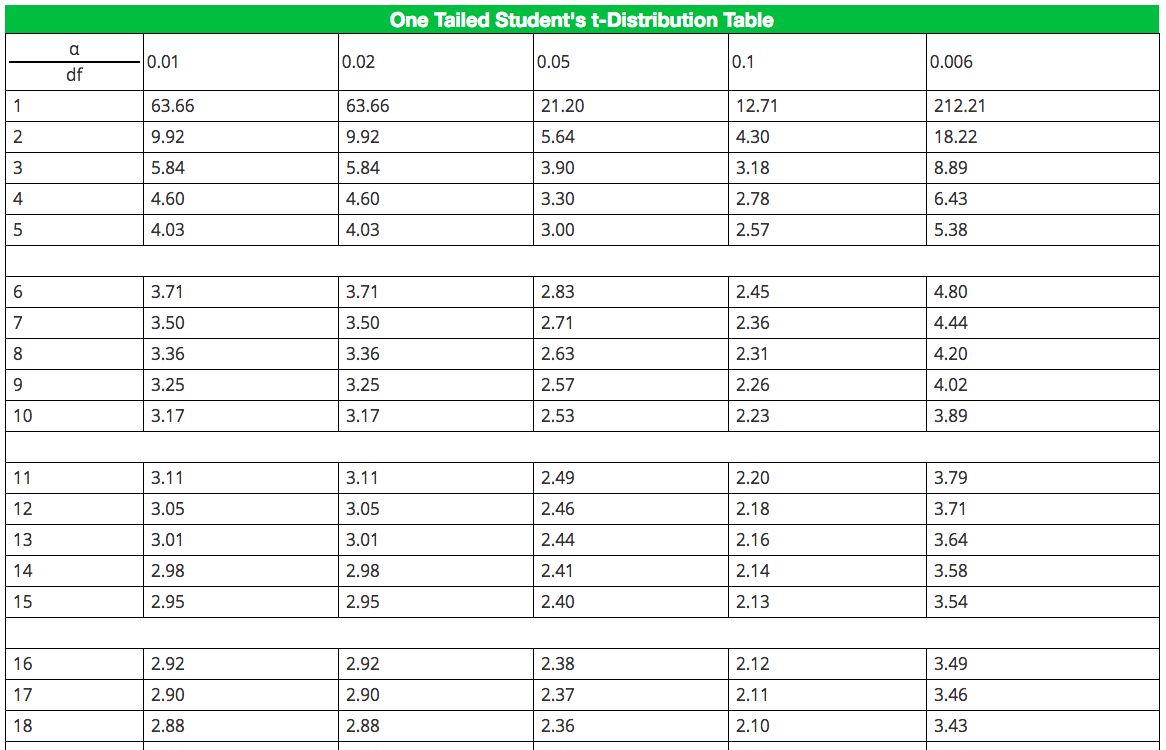
t-Distribution Table for One Tailed t-Test
Student's t-distribution table & how to use instructions to quickly find the critical (rejection region) value of t at a stated level of significance (α = 0.01, 0.05, 0.1 etc or α = 0.1%, 5%, 10% etc) for the test of hypothesis (H0) in one (left or right) tailed t-test conducted from normally distributed small sample sets in the statistics & probability surveys or experiments.
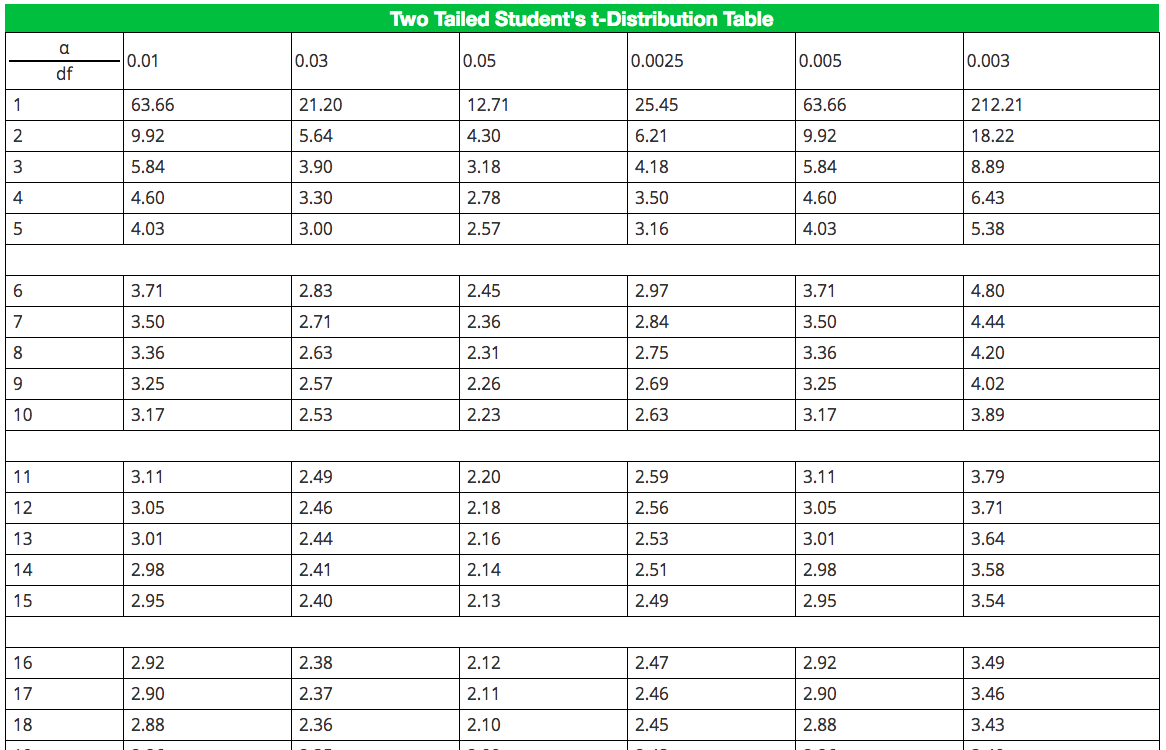
t-Distribution Table for Two Tailed t-Test
Student's t-distribution table & how to use instructions to quickly find the critical (rejection region) value of t at a stated level of significance (α = 0.01, 0.05, 0.1 etc or α = 0.1%, 5%, 10% etc) for the test of hypothesis (H0) in two tailed t-test conducted from normally distributed small sample sets in the statistics & probability surveys or experiments.
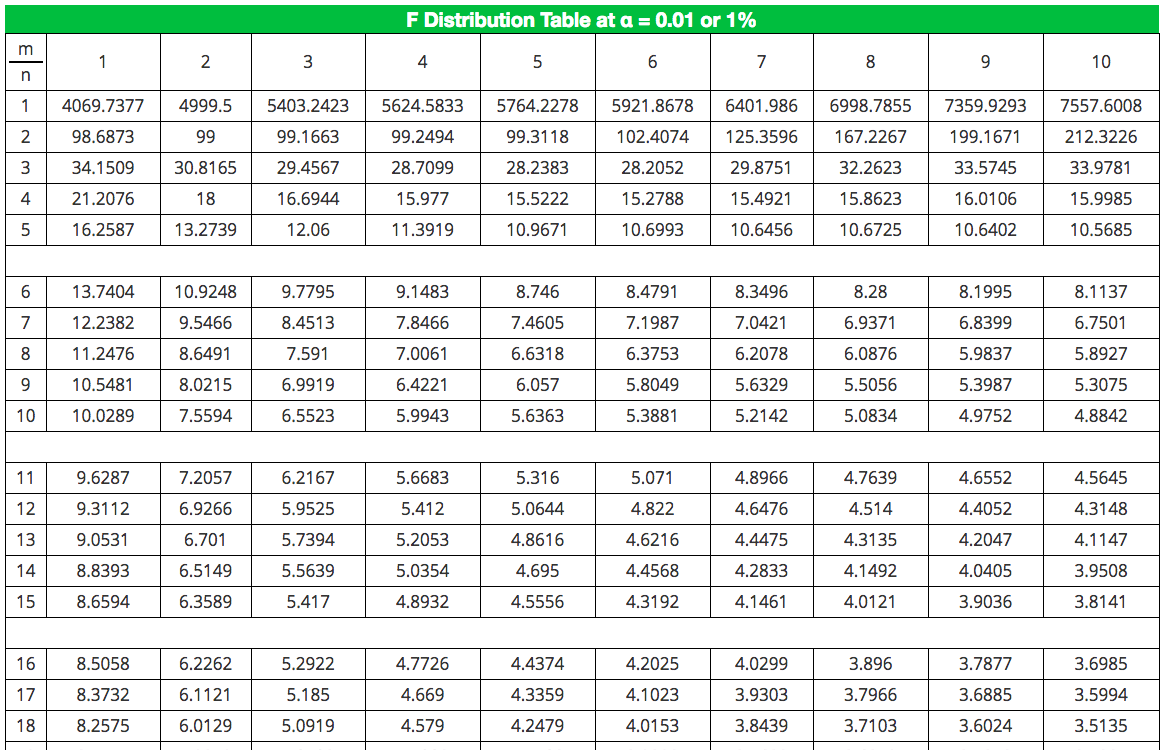
Fisher's F-Distribution Table for F-Test
Fisher's F-distribution table & how to use instructions to quickly find the critical (rejection region) value of F at a stated level of significance (α = 0.01, 0.05, 0.1 etc or α = 0.1%, 5%, 10% etc) for the test of hypothesis (H0) in F-test by comparing two or more sample variances in the statistics & probability surveys or experiments.
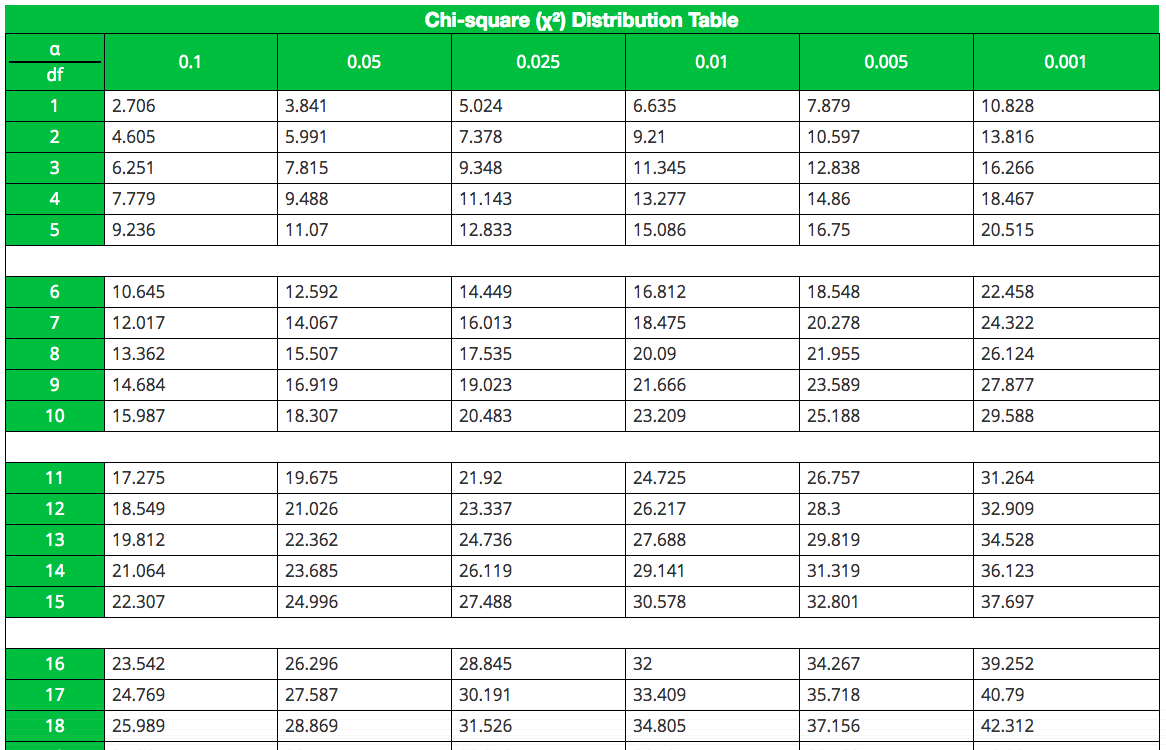
Chi-Squared Distribution Table for χ2-Test
Chi-Squared distribution table & how to use instructions to quickly find the critical value of Χ² at a stated level of significance (α = 0.01, 0.05, 0.1 etc or α = 0.1%, 5%, 10% etc) for the test of hypothesis (H0) in χ2-test by analyzing the distribution which is not normally distributed in the statistics & probability surveys or experiments.
More Statistics & Probability Tables
Apart from finding critical values from different distribution tables, there are some of other important tables such as Binomial, Poisson & Gamma distribution tables also used in statistics & probability theory. Users can refer such tables to solve various statistics & probability experiments or problems by using these tables.
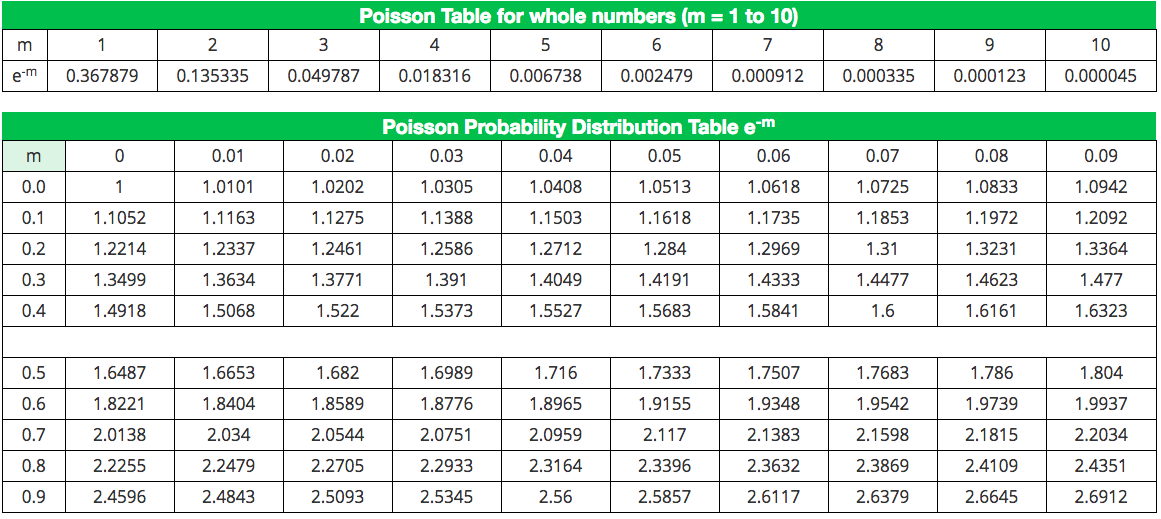
Poisson Distribution Table for e-m
Poisson distribution table & how to use instructions to quickly find the value of e-m in the Poisson equations.
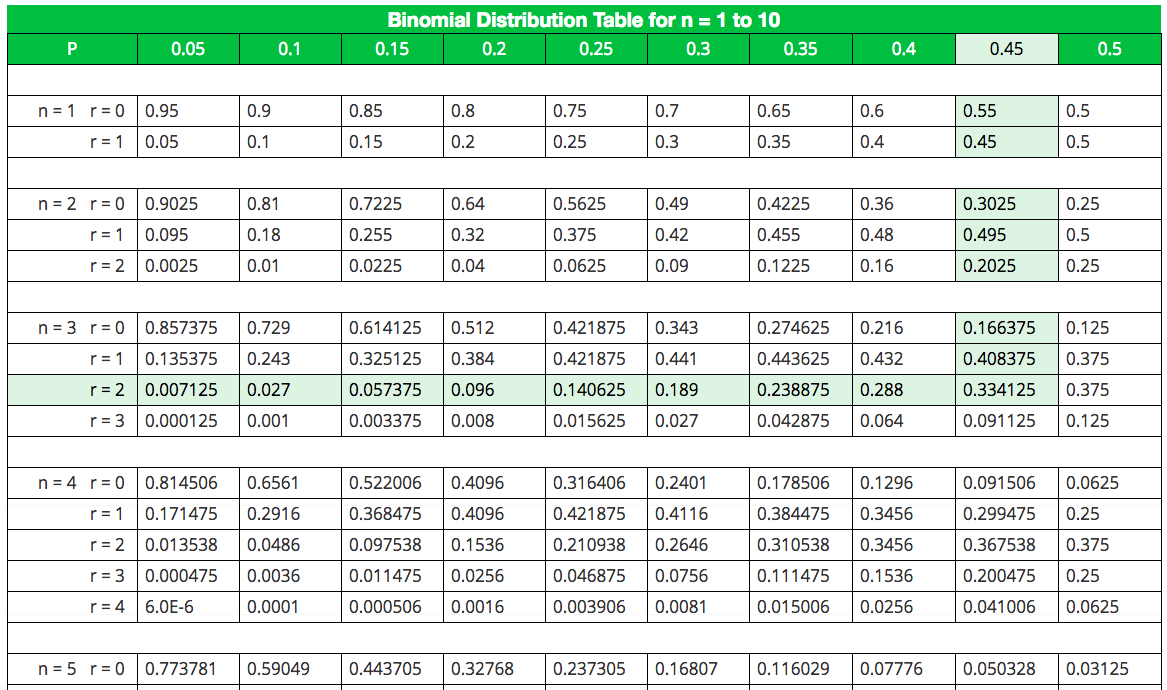
Binomial Distribution Table for n = 1 to 10
Binomial distribution table & how to use instructions to quickly find the probability value of success or failures in Bernoulli experiments.
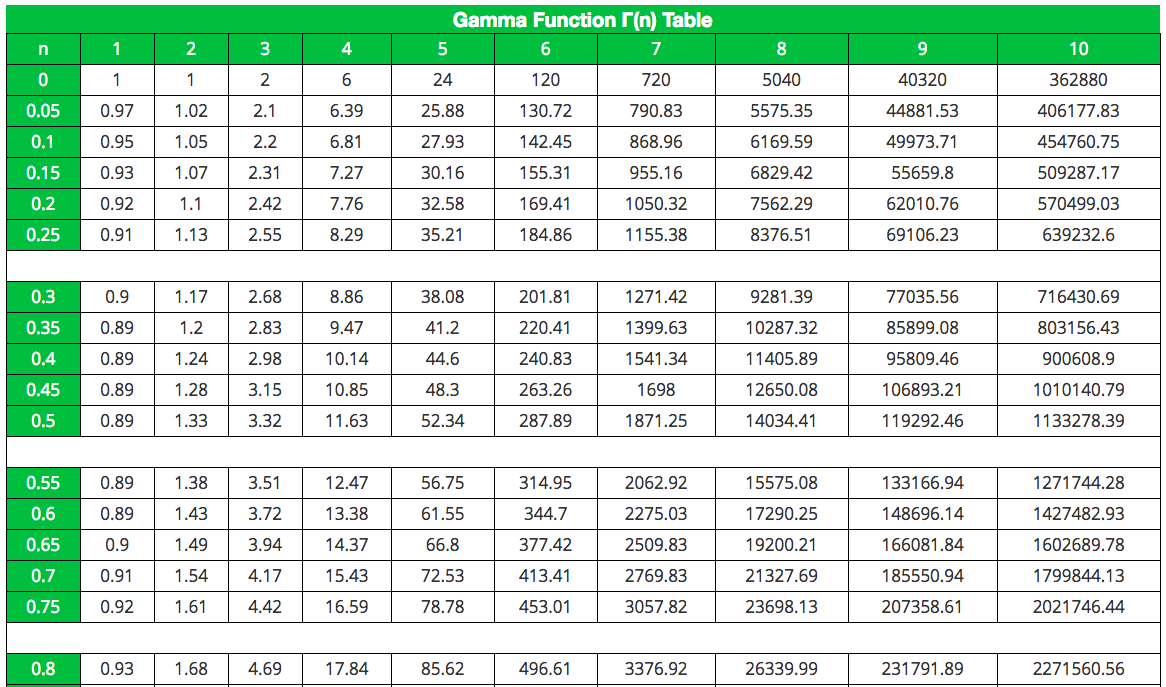
Gamma Function Table for Γ(x)
Gamma function table & how to use instructions to quickly find the gamma function of x to find the factorial of decimal point numbers in statistics & probability experiments.