
F-Test (F0, Fe & H0) Calculator
getcalc.com's F-Test calculator to estimate F-statistic (F0), critical value (Fe) from F-distribution table for given degrees of freedom & hypothesis test (H0) to check if the test of significance is accepted or rejected in statistics & probability experiments. Users can use this calculator to analyze two or more variances together or to generate the complete work with step by step calculation for any corresponding input values to solve grade school F-test worksheet problems.
Why F-Test & Formula
F-Test is the technique using statistical methods to estimate if the test results are statistically significant by analyzing two or more variances. It requires F-statistic F0 & critical (table) value of F-distribution Fe at a stated level of significance (α = 1%, 2%, 3%, 4%, 5%, 10%, 25%, 5% etc or α = 0.01, 0.02, 0.03, 0.04, 0.05, 0.1, 0.25, 0.5 etc) for the test of hypothesis (H0) in statistics & probability surveys or experiments to analyze two or more variances simultaneously. Generally, F-test is the ratio between two or more variances to identify the quality of different variances. The estimated value of F or F-statistic (F0) is compared with the critical value from F-distribution table to check the significance of results. Users may use this below F-test calculator to estimate F-statistic (F0), critical value (Fe) & hypothesis test (H0) to test the significance between two or more sample variances.
Inference
The below statements show when to accept or reject null hypothesis H0 in F-test
For null hypothesis H0 :
If F0 < Fe then the null hypothesis H0 is accepted.
It states that there is no significance difference between F-statistic & expected or critical value of F.
If F0 > Fe then the null hypothesis H0 is rejected.
It states that there is significance difference between F-statistic & expected or critical value of F.
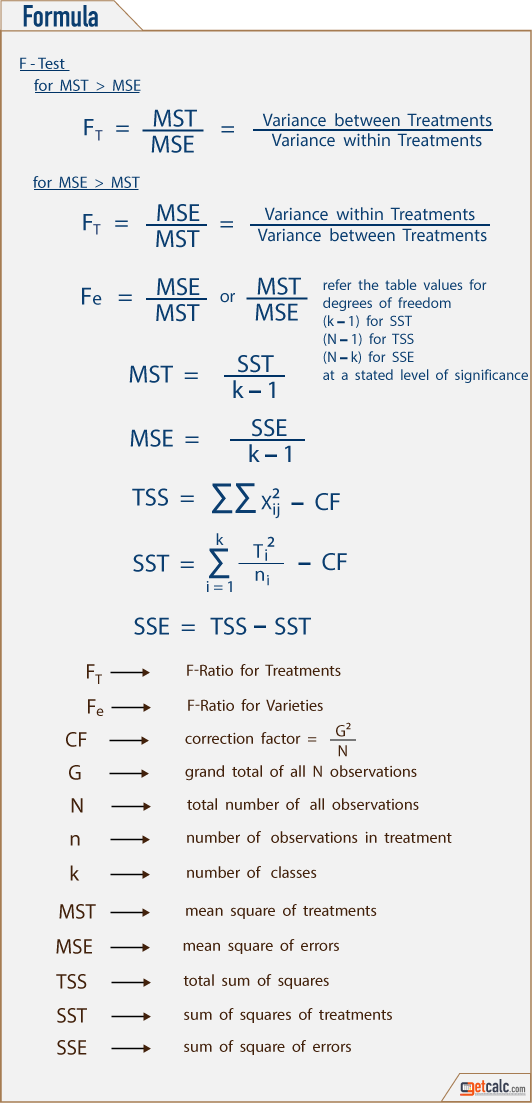
The below is the mathematical representation for F-test formula to estimate the quality of variances among two or more sample variances to predict the characteristics of population parameters of a unknown distribution.
Solved Examples with Work - F-Test
The below are the solved examples for F-Test with step by step estimation to analyze two or more variances together. Users may refer the below estimations to know what formula & input parameters are being used in the respective calculation.