Confidence Interval for Proportion of Finite Population n = 50, p = 0.15, N = 750 & 97% confidence
The probability of unknown parameter of population expected to lie between the confidence interval 0.0441 and 0.2559. The values 0.0441 and 0.2559 are the lower and upper limits of the confidence interval for proportion of finite population estimated from sample size n = 50, proportion p = 0.15, population size N = 750 & Z-score of confidence level for 97% = 2.17 to estimate the confidence interval for proportion of finite population.
Work with Steps for n = 50, p = 0.15, N = 750 & 97% confidence
The complete work with step by step calculation for sample size n = 50, proportion of successes p = 0.15, population size N = 750 & Z-score of confidence level for 97% = 2.17 to estimate the confidence interval for proportion of finite population in statistical experiments.
Workout :
step 1 Address the formula input parameters and values
Sample size n = 50
Proportion = 0.15
Population sample size N = 750
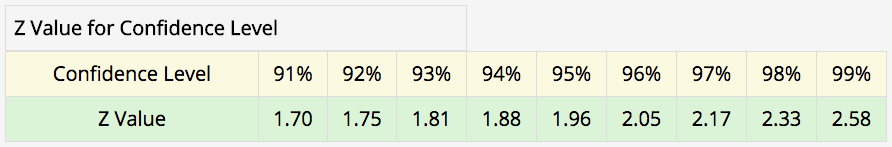
Z-score for 97% confidence level = 2.17
step 2 Substitute the input parameter values in the below formula
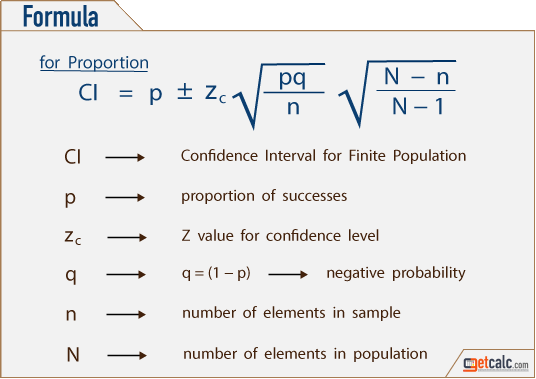
= 0.15 ± 2.17√(0.15 x 0.85)/50√(750 - 50)/(750 - 1)
= 0.15 ± 2.17√(0.1275)/50√700/749
= 0.15 ± 2.17√0.00255 √0.9346
step 3 Simplify the above expression
= 0.15 ± 2.17 x 0.0505 x 0.9667
= 0.15 ± 0.1059
0.15 + 0.1059 = 0.2559 or 0.15 - 0.1059 = 0.0441
The lower limit is 0.0441 and
The upper limit is 0.2559
0.0441 & 0.2559 are the confidence limits for n = 50, proportion = 0.15, N = 750 & Z = 2.17