
One & Two Way ANOVA Calculator
One & Two Way ANOVA calculator is an online statistics & probability tool for the test of hypothesis to estimate the equality between several variances or to test the quality (hypothesis at a stated level of significance) of three or more sample means simultaneously. This calculator is featured to generate the complete ANOVA classification table with steps for any corresponding input values for one way or two way ANOVA calculations. The work with step by step calculations shows how to test the significance several sample means by using one or two way ANOVA technique may useful for learners or grade school students to learn how to solve such ANOVA homework or worksheet problems efficiently.
Table of ContentANOVA (Analysis Of Variance)
ANOVA, the ANalysis Of VAriance is an inference statistic and is a powerful method in probability & statistics for test of significance (hypothesis) between three or more sample means. The statistic functions like test of significance for t-distribution & Z-distribution are only applicable to estimate the test of significance between two sample means, while the Analysis of Variance (ANOVA) allows three or more independent sample means at a time in the statistical experiments to analyze the difference between variances, enable researchers to test the quality (hypothesis at a stated level of significance) of several sample means. Generally, it's a technique or hypothesis test used to investigate the means of three or more sample data sets by using F-statistic (F0) & critical values of F (Fe) from the F-distribution table to test the hypothesis of variances. The F-test is used in the analysis of One Way or Two way ANOVA to check if the null hypothesis is accepted or rejected at a stated level of significance. The ratio of variance between the sample means to the variance within the sample is called as F-statistic. There is no significant difference between several means under investigation, if the null hypothesis is accepted. There is significant difference among several sample variances if the null hypothesis is rejected.
ANOVA test is similar to student's t-test with the null hypothesis when the variations under investigation involves only two sample set of data. Students's t-test statistic produces the same result as F-statistic for ANOVA test with 2 sample data set. For the analysis of more than 2 variances, the multiple t-tests increase the complications to compare more than two sample means, leads to increase the error in the results. Therefore, the ANOVA tests are comes into effect to avoid such complications and errors. The ANOVA test is said to be Balanced or Unbalanced experiment, if the sample size drawn from populations are equal or unequal accordingly. Users may use this ANOVA test calculator for the test of significance (hypothesis) or generate complete step by step calculation.
Critical Value from F-Distribution Table
In one way & two way ANOVA, the F-test is used to find the critical value or table value of F at a stated level of significance such as 1%, 5%, 10%, 25% etc. For example 1% and 5% of significance are represented by F0.01 and F0.05 respectively. This expected or critical F-value Fe is compared with calculated or F-statistic F0 in the ANOVA experiments to accept or reject the hypothesis. As the F-test plays an important role to examine the various ratios of variances to see which ratios are statistically significant.
One-Way ANOVA
One-way ANOVA is an inferential statical model to analyze three or more than three variances at a time to test the equality between them. It's a test of hypothesis for several sample means investigating only one factor at k levels corresponding to k populations is called One Way ANOVA. Users may use this 1-way ANOVA test calculator to generate the ANOVA classification table for the test of hypothesis by comparing estimated F-statistic (F0) from the samples of populations & critical value of F (Fe) at a stated level of significance (such as 1%, 2%, 3%, 4%, 5% etc) from the F-distribution table. Only one factor can be analyzed at multiple levels by using this method. This technique allows each group of samples to have different number of observations. It should satisfy replication & randomization to design the statistical experiments.
ANOVA Table for One-Way Classification
ANOVA table for one-way classification shows what are all the formulas & input parameters used in the analysis of variance for one factor which involves two or more than two treatment means together to check if the null hypothesis is accepted or rejected at a stated level of significance in statistical experiments.
| Sources of Variation | df | SS | MSS | F-ratio |
| Between Treatment | k - 1 | SST | SSTk-1 = MST | MSTMSE = F T |
| Error | N - k | SSE | SSEN-k = MSE | |
| Total | N - 1 |
The one-way ANOVA test is carried out based on these below assumptions,
- The observations are normally distributed
- The observations are independent from each other
- The variance of populations are equal
Notable Points for One-Way ANOVA Test
The below are the important notes of one-way ANOVA for test of hypothesis for a single factor involves three or more treatment means together.
- The null hypothesis H0 : μ1 = μ2 = . . . = μk
Alternative hypothesis H1 :
μ1 ≠ μ2 ≠ . . . ≠ μk - State the level of significance α (1%, 2%, 5%, 10%, 50% etc)
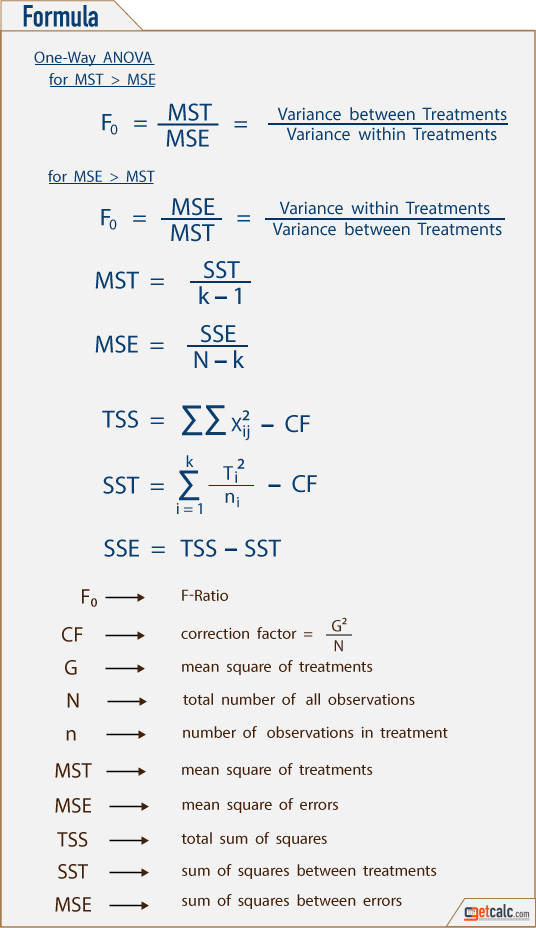
- The sum of all N elements in all the sample data set is known as the Grand Total and is represented by an English alphabet "G".
- The correction factor CF = G2/N
- The Total Sum of Squares all individual elements often abbreviated as TSS is obtained by
TSS = ∑∑xij2 - CF - The Sum of Squares of all the class Totals often abbreviated as SST is obtained by
SST = ∑Ti2/ni - CF - The Sum of Squares due to Error often abbreviated as SSE is obtained by
SSE = TSS - SST - The degrees of freedom for Total Sum of Squares
TSS = N - 1 - The degrees of freedom for Sum of Squares of all the class Totals
SST = k - 1 - The degrees of freedom for Sum of Squares due to Error
SSE = N - k - The Mean Sum of Squares of Treatment often abbreviated as MST is obtained by
MST = SST/(k - 1) - The Mean Sum of Squares due to Error often abbreviated as MSE is obtained by
MSE = SSE/(N - k) - The variance ratio of F between the treatment is the higher variance to lower variance
F = MST/MSE or MSE/MST (The numerator should be always high) - The Critical value of F can be obtained by referring the F distribution table for (k-1, N-k) at stated level of significance such as 1%, 5%, 9%, 10% or 50% etc.
- The difference between the treatments is not significant, if the calculated F value is lesser than the value from the F table. Therefore, the null hypothesis H0 is accepted.
- The difference between the treatments is significant, if the calculated F value is greater than the value from the F table. Therefore, the null hypothesis H0 is rejected.
Two-Way ANOVA
Two Way ANOVA is an inferential statical model to analyze three or more than three variances at a time to test the equality & inter-relationship between them. It's a test of hypothesis for several sample means to analyze the inter-relationship between the factors and influencing variables at k levels corresponding to k populations is called as Two way ANOVA. Users may use this 2-way ANOVA test calculator to generate the ANOVA table for the test of hypothesis (H0) for treatment means & subject or class means at a stated level of significance with the help of F-distribution. In this analysis of variance, the observations drawn from the populations should be in same length. This models should satisfy replication, randomization & local control to design statistical experiments. Users may use this 2-way ANOVA test calculator to generate the ANOVA classification table for the test of hypothesis (H0) for treatment means & varieties (class) means at a stated level of significance with the help of F-test.
ANOVA Table for Two-Way Classification
ANOVA table for two-way classification shows what are all the formulas & input parameters used in the analysis of variance for more than one factor which involves two or more than two treatment means together with null hypothesis at a stated level of significance.
| Sources of variation | df | SS | MSS | F-ratio |
| Between treatment | k - 1 | SSR | SSRk - 1 = MST | MSTMSE = FR |
| Between block | h - 1 | SSC | SSCh - 1 = MSV | MSVMSE = FC |
| Error | (h - 1)(k - 1) | SSE | SSE(k - 1)(h - 1) = MSE | |
| Total | N - 1 |
The two-way ANOVA test is carried out based on these below assumptions,
- The observations are independent from each other
- The observations are normally distributed
- The variance of populations are equal
Notable Points for Two-Way ANOVA Test
The below are the important notes of two-way ANOVA for test of hypothesis for a two or more factors involves three or more treatment or subject means together.
- The null hypothesis H0 : μ1 = μ2 = . . . = μk
H0 : μ.1 = μ.2 = . . . = μ.h
Shows no significant difference between the variances.
Alternative Hypothesis H1 :
H1 : μ1 ≠ μ2 ≠ . . . ≠ μk
H1 : μ.1 ≠ μ.2 ≠ . . . ≠ μ.h
Shows the significant difference among the variances. - State the level of significance α (1%, 2%, 5%, 10%, 50% etc)
- The sum of all N elements in all the sample data set is known as the Grand Total and is represented by an English alphabet "G".
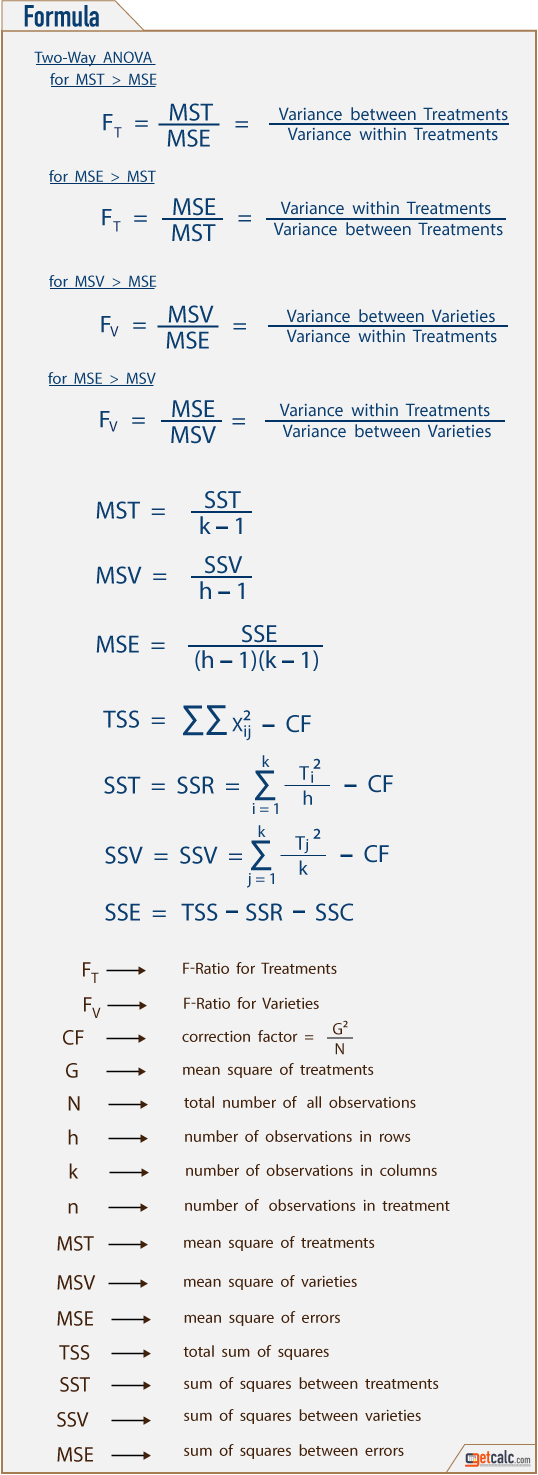
- The correction factor CF = G2/N = G2/kh
- The Total Sum of Squares of all individual elements often abbreviated as TSS is obtained by
TSS = ∑∑xij2 - CF - The sum of squares of all the treatment (row) totals in the two-way table (h x k) often abbreviated as SST is obtained by
SST = SSR = ∑ {Ti.2/h} - CF - The sum of squares between classes or sum of squares between columns is
SSV = SSC = {T.j2/k} - CF
k is the number of observations in each columns - The sum of squares due to error often abbreviated as SSE is obtained by
SSE = TSS - SSR - SSC - The degrees of freedom for Total Sum of Squares
TSS = N - 1 = hk - 1 - The degrees of freedom for Sum of Squares between treatments
SST = k - 1 - The degrees of freedom for Sum of Squares between varieties
SSV = h - 1 - The degrees of freedom for error sum of squares
SSE = (k - 1)(h - 1) - The Mean Sum of Squares of Treatment often abbreviated as MST is obtained by
MST = SST/(k - 1) - The Mean Sum of Squares for varieties often abbreviated as MSE is obtained by
MSV = SSV/(h - 1) - The Mean Sum of Squares due to Error often abbreviated as MSE is obtained by
MSE = SSE/(h - 1)(k - 1) - The variance ratio for treatments FR is the higher variance to lower variance
FR = MST/MSE or MSE/MST (The numerator should be always high) - The variance ratio for subjects or classes Fc is the higher variance to lower variance
Fc = MSV/MSE or MSE/MSV (The numerator should be always high) - The Critical value of F for between treatments (rows) can be obtained by referring the F distribution table for (k-1, (k-1)(h-1)) at stated level of significance such as 1%, 5%, 9%, 10% or 50% etc.
- The Critical value of F for between varieties (columns) or subjects can be obtained by referring the F distribution table for (h-1, (k-1)(h-1)) at stated level of significance such as 1%, 5%, 9%, 10% or 50% etc.
- The difference between the treatments (rows) is not significant, if the calculated Fe value is lesser than the value from the F table. Therefore, the null hypothesis H0 is accepted.
- The difference between the treatments (rows) is significant, if the calculated F value is greater than the value from the F table. Therefore, the null hypothesis H0 is rejected.
- The difference between the subjects or varieties (columns) is not significant, if the calculated Fe value is lesser than the value from the F table. Therefore, the null hypothesis H0 is accepted.
- The difference between the subjects or varieties (columns) is significant, if the calculated F value is greater than the value from the F table. Therefore, the null hypothesis H0 is rejected.
ANOVA Formulas
Users may refer the below ANOVA formulas for one-way & two way classification to analyze three or more than three treatment means together to test the homogeneity (hypothesis at a stated level of significance) of variances. Users may use these ANOVA formulas to know what are all the input parameters are being used in one way & two way ANOVA tests to generate the ANOVA table by investigating one or two factors at multiple levels or use this calculator to verify such results or generate the complete work with step by step estimation for one-way or two-way ANOVA worksheet or homework problems.
Example Calculations
The below are the one-way & two-way ANOVA calculation examples to help beginners to know how to analyze three or more than three treatment means together and generate the corresponding ANOVA table of summary. These examples guide beginners what are all the formulas & comparisons being used in one way & two way ANOVA test at a stated significance level with the help of F-distribution table. Users may generate either one way ANOVA table or two way ANOVA table for any corresponding input values to analyze the multiple treatment means or variances.