Standard Deviation for 10, 20, 30, 40, 50, 60, 70, 80, 90 and 100
s = 30.2765σ & 28.7228σ for sample & total population respectively for the dataset 10, 20, 30, 40, 50, 60, 70, 80, 90 and 100.
The complete work with step by step calculation for 10, 20, 30, 40, 50, . . . . , 90 and 100 may helpful for grade school students, beginners or learners to solve the similar standard deviation worksheet problems to estimate the degree of uncertainty, or how much the whole members in a group deviates from its mean or common behavior of sample data distribution, to draw the conclusions of population data distribution to improve the quality of process.
Estimate Degree of Uncertainty for 10, 20, 30, 40, 50, 60, 70, 80, 90 and 100?
The below workout with step by step work or calculation may help users to understand how to estimate what is the standard deviation for the data set 10, 20, 30, 40, 50, . . . . , 90 and 100 to summarize the degree of uncertainty or linear variability of whole elements in a group of sample elements, to draw the conclusion about the characteristics of population data in the statistical experiments.
Workout :
step 1 Address the formula, input parameters & values
Input parameters & values
x1 = 10, x2 = 20, . . . . , x10 = 100
Number of samples n = 10
Degrees of freedom = n - 1
= (10 - 1) = 9
Find sample standard deviation of 10, 20, 30, 40, 50, 60, 70, 80, 90 and 100
step 2 Find the mean for 10, 20, 30, 40, 50, 60, 70, 80, 90 and 100
µ =
n
∑
i = 1
Xin
=(10 + 20 + 30 + . . . . + 100)/10
µ = 55
step 3 Apply the samples, mean & degrees of freedom values in the below sample standard deviation formula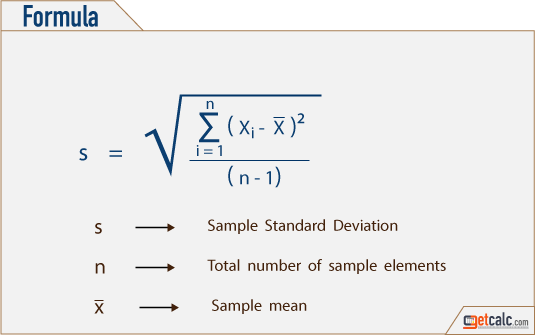
=√{ (10 - 55)² + (20 - 55)² + (30 - 55)² + . . . . + (100 - 55)²}/9
= √(-45)² + (-35)² + (-25)² + . . . . + (45)²/9
= √(2025 + 1225 + 625 + . . . . + 2025)/9
= √8250/9
= √916.6667
s = 30.2765
For the dataset 10, 20, 30, 40, 50, 60, 70, 80, 90 and 100
55 is the mean
30.2765 σ is the estimated (sample) standard deviation
916.6667 is estimated (sample) variance
28.7228 σ is the standard deviation of finite population
825 is the variance of finite population